


Economic pressure isn't stopping travel—it’s just changing the math. Consumers are cutting back elsewhere to protect their travel budgets, prioritizing high-value experiences like stellar meals, upgraded rooms, and can't-miss events. This is especially true for Tripadvisor’s audience of high-spending frequent travelers. Here, we’re breaking down which experiences these consumers value most and where they’re choosing to spend along their journey.
Meet the travelers
frequent travelers
Took 2+ trips in the past 12 months
OCCASIONAL travelers
Took 1 trip in the past 12 months
LAPSED travelers
Took at least 1 trip in the past 2 years, but none in the past 12 months
Top takeaways, at a glance


Travelers are a valuable audience—frequent travelers, even more so. While discretionary spending makes up 35% of consumers' typical monthly spend, that number rises to 37% among frequent travelers. Among lapsed travelers, that number drops to 28%—marking a nine-point drop in the share of spending available for non-essential categories such as travel, dining, shopping, and entertainment.
frequent travelers
The more people travel, the more they have to spend. And frequent travelers aren’t just spending more—a greater share of their funds is available across all discretionary categories.
Younger generations and international travelers also have higher discretionary spending than average.

40%
Gen Z

36%
Millennials

36%
International
travelers
Across all consumers, travel represents the largest share of discretionary spending, ahead of all other categories like dining and shopping.
Where discretionary spending goes:
23%
Travel & holidays
18%
Dining out & drinks
17%
Shopping
13%
Hobbies & interests
10%
Entertainment
8%
Local experiences
5%
Beauty
4%
Electronics
Travel's share rises to

35%
among boomers

29%
among couples
A typical travel budget:

The travel dollar goes far
Spending isn't concentrated in a single travel category—one trip can create reasons to spend across the entire ecosystem. Accommodations and transportation account for nearly half the typical travel budget, with food and dining, shopping, experiences and entertainment collectively capturing the other half.


When budgets tighten, travelers adapt their trips before abandoning them. And when there’s money to spare, they’re most eager to spend on travel over all other categories.

are concerned about the broader economic situation
64%

But travel is still a priority: 46% intend to travel as planned and 43% expect to make some changes to their travel plans.
Economic pressure is reshaping travel, not stopping it
Rather than give up on their trips altogether, travelers are finding clever ways to make things work—trading down, shortening stays, or changing destinations.
How travelers adapt when costs rise:
31%
Lower-cost accommodations
28%
Shorter trips
28%
Lower-cost destinations
26%
Fewer trips
26%
Off-peak travel
Where travelers cut first:
CUT LAST
CUT FIRST
Dining out
Shopping/clothing
Entertainment
Travel
Local experiences & activities
26%
17%
13%
13%
7%
Travel survives budget cuts
Travel isn’t seen as just another expense—consumers place serious value on the experience of getting away. If they do have to cut spending, travel tends to remain a nonnegotiable even as other categories like dining out and shopping fall off.

82%
of travelers would cut other categories before cutting experiences or activities.
Travel is the first thing to make the budget
Given an extra $1,000 to spend, more than one-third of all consumers would put it toward travel and vacations.

Where an extra $1,000 would go:


Travel spending has some serious momentum, with 40% of consumers maintaining a consistent travel spend over the last two years, and one-third (32%) spending even more. Younger generations are pushing that growth even further: Nearly half (44%) of Gen Z have increased their leisure-travel spending in the past two years.
But travel's spending growth isn't confined to getting there and staying there. Food and dining—a major part of any trip and any trip budget—has seen the greatest increase in spending in the past two years.
Where travel spend has grown over the last two years:
33%
Food & dining
32%
Transportation & flights
31%
Accommodation
26%
Shopping
25%
Experiences & activities
21%
Entertainment & nightlife
The meals make the itinerary
Dining is a core part of the travel experience: 87% of travelers visit a restaurant, 74% a café, and 52% a bar or pub at least once while traveling. But frequent travelers aren't just picking the closest, easiest spot to grab a bite—they're willing to go the extra mile for a great meal.
frequent travelers
Compared to lapsed travelers, frequent travelers are:
1.3x more likely to spend more on dining when traveling
Index 128
2.9x more likely to travel farther to visit a restaurant they want to try
Index 286
3x more likely to seek out highly rated or recommended restaurants
Index 300
Shopping every step of the way
Shopping is a big part of travel. But spending opportunities go well beyond the trip itself, from the carry-on-approved toiletries and travel insurance pre-trip to the souvenirs that inspire future purchases back at home.
What travelers buy before they take off:
41%
Food, snacks, or drinks for their trip
39%
Travel-sized toiletries or other travel essentials
31%
Travel insurance
28%
Beauty, skincare, or personal care products
27%
Foreign currency or travel money
25%
Luggage, bags, or travel accessories
Your packing list, handled.
Dig into Travelers’ Favorites, the essentials from traveler-loved brands that’ll make your trip the best one yet.
Read more


The shopping mindset shifts in-destination, becoming less about what travelers need and more about what’s calling out in the moment, from trinkets for the shelves back home to far-flung pantry staples.
What travelers shop for most:
51%
Souvenirs & gifts
46%
Treating themselves
36%
Local & specialty products
24%
Shopping as part of travel experience
23%
Food & drink to take home
21%
Impulse purchases
20%
Buying things that are cheaper than at home
12%
Fashion & trends
frequent travelers
Frequent travelers drive greater spending throughout their trips, with 45% shopping multiple times—significantly more than occasional (36%) and lapsed travelers (31%).
Frequent
Occasional
Lapsed
45%
36%
31%

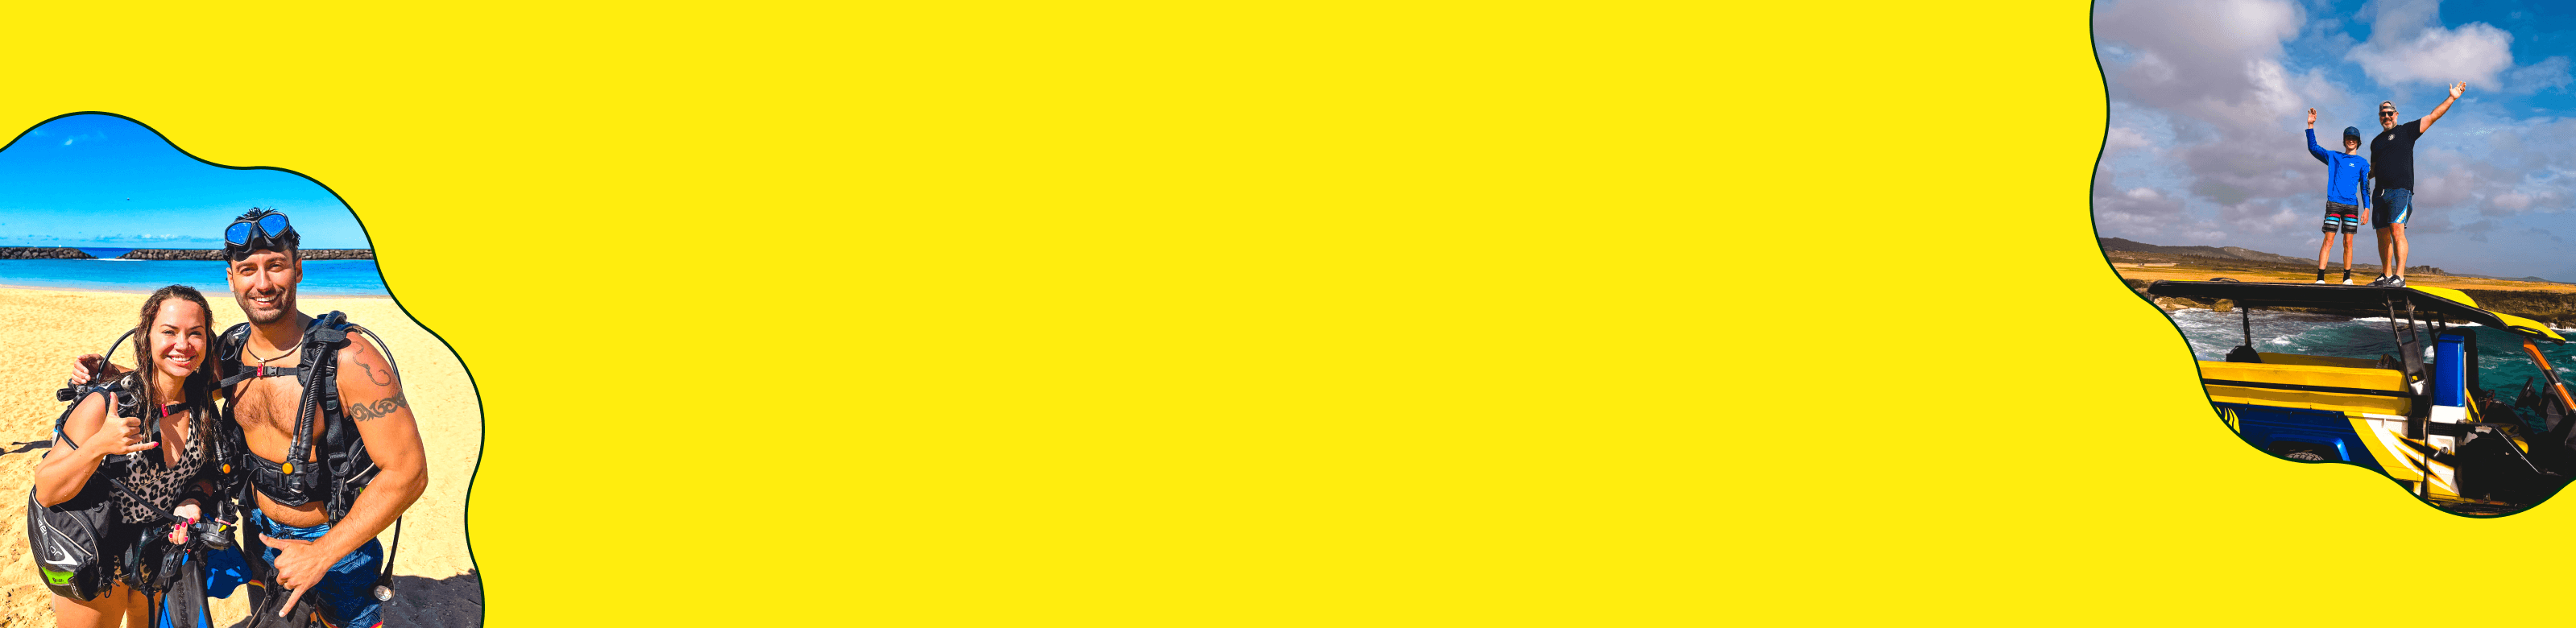
Travelers are willing to spend more to make a trip more meaningful. If it’s something that creates lasting memories or something that really can’t be done back home, they’ll find a way to make it work, even if it means exceeding their planned budget.
Experiences are emerging as the whole reason to go, with one in three travelers booking a trip around a specific experience, activity, or event. That appetite for event-led experiences is widespread, with 86% of travelers drawn to things like food festivals, art exhibitions, and concerts. And 62% have traveling specifically to attend a ticketed event in the past year.
Frequent travelers are all about flex-lux
Frequent travelers are willing to spend more than occasional travelers on memorable experiences (31% vs. 24%), food and dining (33% vs. 27%), and accommodations (23% vs. 14%). But it’s not all-out fancy, all the time.
They’re savvy about where to save—often on entertainment and nightlife—so they can spend more freely on what they’re most excited about. And those splurges aren’t limited to luxury: they’re also paying for comfort, convenience, and memorable experiences.
How travelers pay
Travel spending is deeply connected to loyalty programs and rewards. Credit cards are the most-used payment method for leisure travel, with nearly a third of travelers using rewards points to help pay for—or reduce the cost of—a recent trip.
Most-used payment methods on recent leisure trips:
Credit card
60%
Debit card
46%
Cash
42%
Digital wallet
24%
BNPL
8%
Rewards and loyalty programs used on most recent leisure trip:
Credit-card rewards points
31%
23%
Cashback
18%
Hotel loyalty points
17%
Airline miles
15%
Travel loyalty/member benefits
13%
Travel vouchers or gift cards
Methodology & Source
Based on Tripadvisor’s Economic Portrait of Travelers study, conducted in August–September 2026. Global market coverage includes the US, UK, Australia, and Japan.
Source: Tripadvisor EPOTT consumer study; Sep 2026; Markets surveyed: USA, UK, Australia & Japan. Sample n=3909.
Frequent travelers: Those who have taken 2+ trips in the past 12 months
Occasional travelers: Took 1 trip in the past 12 months
Lapsed travelers: Took at least 1 trip in past 2 years but 0 trips in last 12 months
Written by Wynne Levy. Designed by Tia Abdullah
Data research by Aarushi Kumar
Disclaimer: This report is for promotional and informational purposes only. It is based on internal Tripadvisor data and cited third-party sources. While all data is believed to be accurate at the time of publication, Tripadvisor makes no representation or warranty, express or implied, regarding the completeness or accuracy of the information provided and assumes no liability for its use or interpretation. Past performance and trend growth are not indicators of future results.